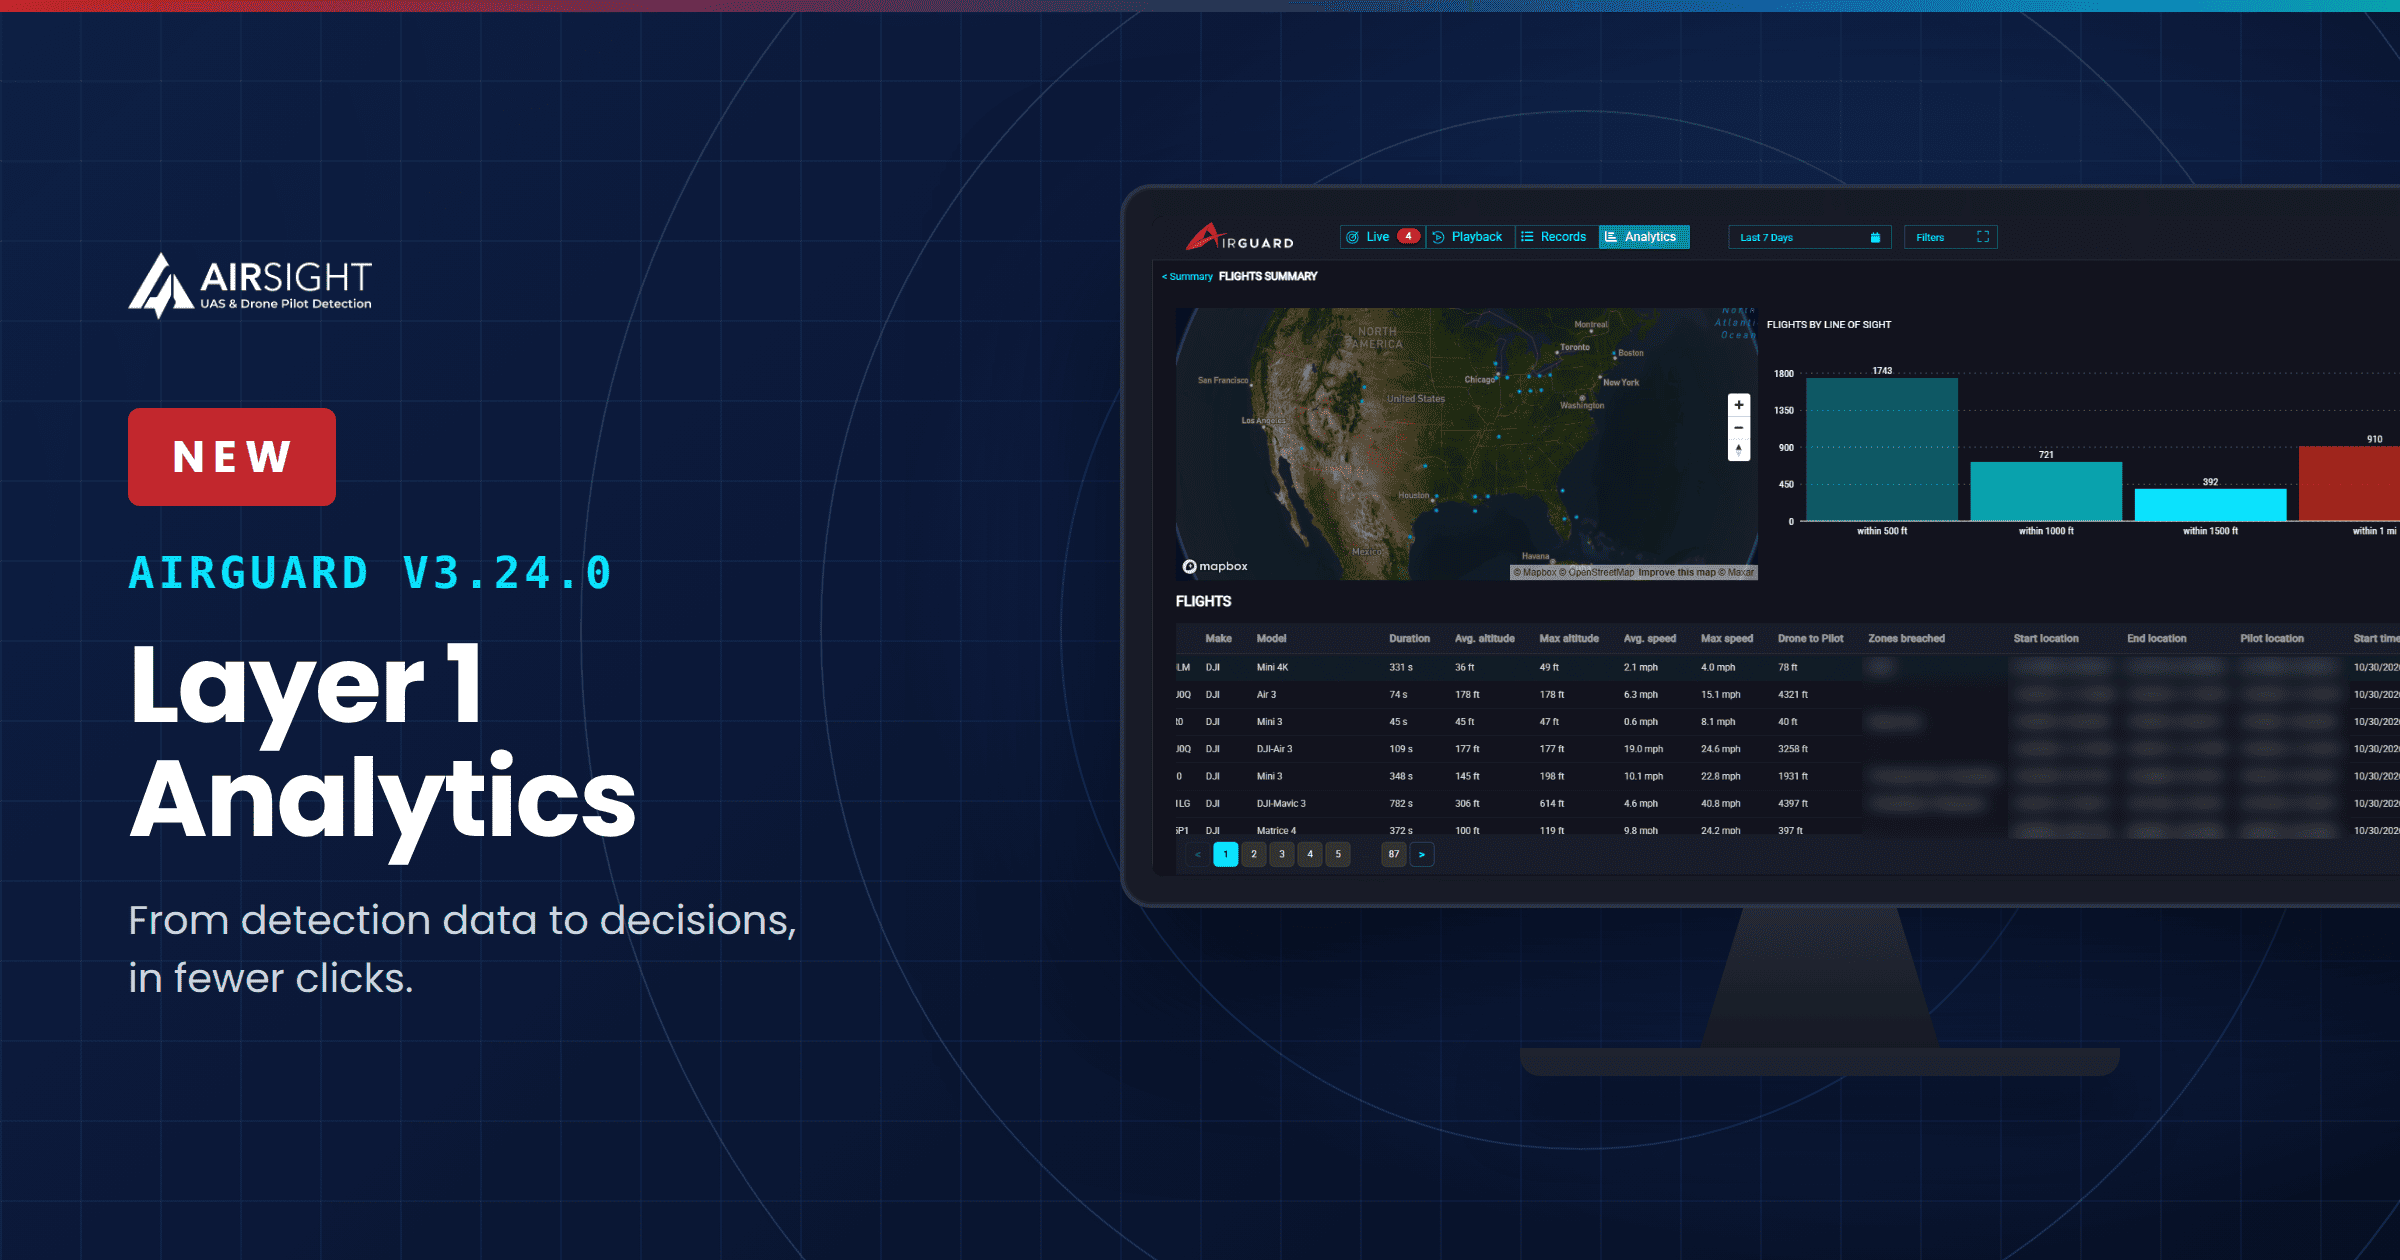
Today, AirSight announced new analytics tools in AirGuard, the drone detection software platform, built for AirGuard's RF detections (Layer 1). Security teams can now follow a suspicious drone model down to a single flight replay without re-entering a filter. They can spot repeat offenders and risky flight patterns at a glance and share polished findings in minutes, all inside AirGuard.
Until now, security managers and analysts had to rebuild the data outside the platform to pull insights together and share them. AirGuard's Analytics now surfaces more of those insights on its own and presents them more clearly and directly. With these new tools, the security team can spend more time on what matters: finding and acting on real drone threats.
38 Drone Drops, 10 Prisons and Why Drone Analytics Matters
On June 24, federal prosecutors in Georgia unsealed an indictment charging 12 people in what the U.S. Attorney's Office for the Middle District of Georgia calls the largest federal prosecution to date involving coordinated drone smuggling into prisons. The indictment alleges that the group used six drones to drop contraband at least 38 times into ten federal prisons between September 2023 and May 2026. CNN reported that the drops happened at night.
The pattern stands out more than any single flight does: a handful of drones returning again and again, after dark, across multiple sites. Finding that kind of pattern by hand takes weeks of digging through tables, while Layer 1 Analytics in AirGuard puts it on screen. The Top Offenders chart shows which drones keep coming back, and the Flights by Time Window chart shows when they fly. The pilot location column points to where they launch from, and a PDF export puts the findings in investigators' hands.
What This New Analytics Delivers
Analytics for RF Detections organizes every RF detection into three reports (Models, Drones and Flights), which link together into one connected investigation. Each report gives security teams the charts they ask for, and every finding is easy to share.
Investigate a lead without re-entering filters
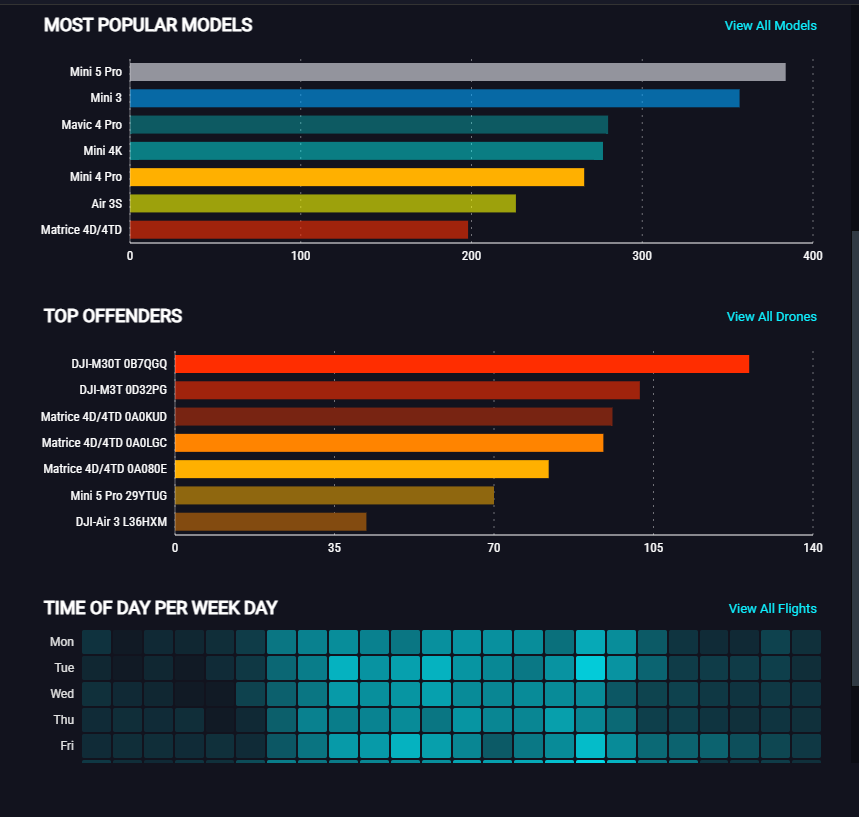
You can now start with a suspicious model and click straight through to its drones, their flights and a full replay, in that order. Start with the pattern. Drill into a model. “View Drones” opens the Drones report, already filtered to that model. Next, select “View Flights” for the drone that caught your attention. That link opens every flight by that drone. Finally, select “View Record” to watch the flight in Record’s playback.
The risky patterns stand out, all on one screen
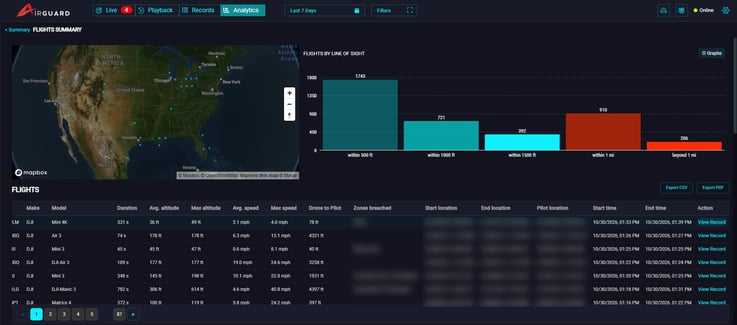
The Analytics reports now include charts for repeat offenders, after-dark activity, and flights far beyond line of sight or unusually high in the sky.
- Spot repeat offenders: The new Top Offenders chart in the View All Drones report ranks drones by alert zone breaches. When investigating, ask: is the same drone coming back? Drill in with View Flights.
- Know when the drones fly: The new Flights by Time Window chart in the View All Flights report splits activity into four windows (6am–6pm, 6pm–9pm, 9pm–midnight and midnight–6am) so that unusual activity stands out. During an investigation, ask: when should we staff up?
- Know how far the drones fly from the pilot: The new Flights by Line of Sight chart in the View All Flights report groups flights by drone-to-pilot distance, from within 500 ft to beyond 1 mile. During an investigation, ask: how many flights are far from their pilot?
- Know how high the drones fly: The new Flights per Max Altitude chart in the View All Flights report shows, in bands from 100 ft to above 800 ft, how many flights went unusually high. When investigating, ask: how many flights went unusually high?
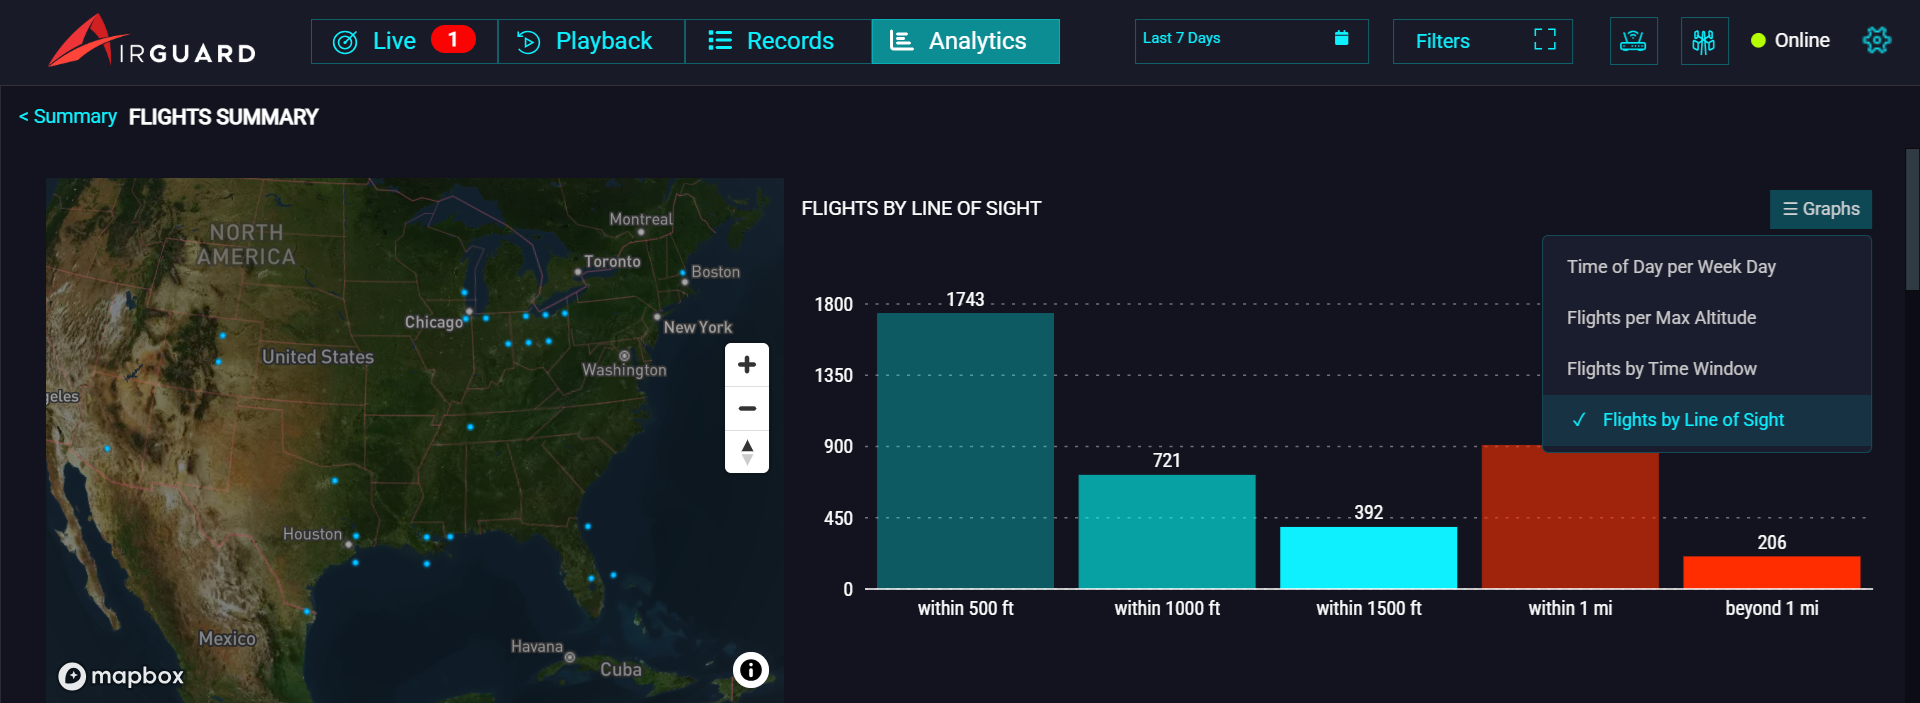
The Flights report also gains seven new columns: Drone to Pilot, Zones breached, Start location, End location, Pilot location, Start time and End time. For many teams, the pilot is who they actually respond to, so seeing pilot location and drone-to-pilot distance on every flight makes a real difference on the ground.
Share findings straight from AirGuard, in minutes, not hours
Sharing used to mean rebuilding the information, which took hours and left room for errors. Findings now leave AirGuard ready to use.
- Export to PDF: Get a clean, formatted report with charts and the filtered, sorted table, exactly as it appears on screen. Leadership, partners and authorities can read it without access to AirGuard.
- Spreadsheet-ready CSV: Values export as plain numbers, and units move into the column headers, so the values go straight into formulas without any clean-up.
Filtering and Sorting Data Values
Filtering also makes analysis faster. To open the filter, click the funnel on any column header, then enter a value and apply it. Filters on different columns work together, so you can narrow results step by step. When you sort a column, an arrow shows which column is sorted and in which direction.
How It Works: Five Steps from Pattern to Shared Finding
- Spot: Start with the pattern. The Analytics Summary shows the most popular models and the Top Offenders, which are the drones that breach your zones most often.
- Drill into a model: View Drones opens the Drones report already filtered to that model, listing flights, breaches and first seen date for each drone.
- Drill into a drone: View Flights opens every flight by that drone, along with start and end location, pilot location, drone-to-pilot distance and the zones it breached.
- Replay: View Record opens the flight in Records playback, so you can see exactly what happened.
- Share: Export PDF turns the filtered report into a document that leadership, partners or authorities can read as it is. You can choose whether to include charts and whether to export the first page, the page on screen or all pages (up to 100).
Three clicks take you from a model to the flight replay, and one more click takes you from analysis to a report you can send. Nothing has to be re-typed or rebuilt.
Example of how to investigate a top offender:
Here’s one way to investigate a top offender. On the Analytics page, open the View All Drones section and select the Top Offenders chart. Sort the table by number of breaches in descending order to find the drone that has breached your zones most often. Then select View Flights to open that drone’s flights, already filtered by its drone ID. There you can review details such as drone-to-pilot distance, zones breached, flight duration and pilot location. Finally, select View Record to watch the playback for that specific flight.
Built Around the Way Security Analysts Investigate
Security analysts would rather spend their time investigating than rebuilding data. They want to see the patterns that matter immediately, so they can deliver the findings their team needs.
“With the new Analytics for RF Detections (Layer 1), AirGuard lets security teams follow a lead from a drone model all the way to a single flight, spot the patterns that matter and share what they find. That leaves them more time for finding real drone threats and acting on them.” - Robert Tabbara, Founder & CEO, AirSight
Find out how Analytics for RF Detections (Layer 1) takes your team from drone detection data to decisions in fewer clicks, and book a demo to see what it can do for your team.